Visualizing attention maps of diffusion models
Introduction
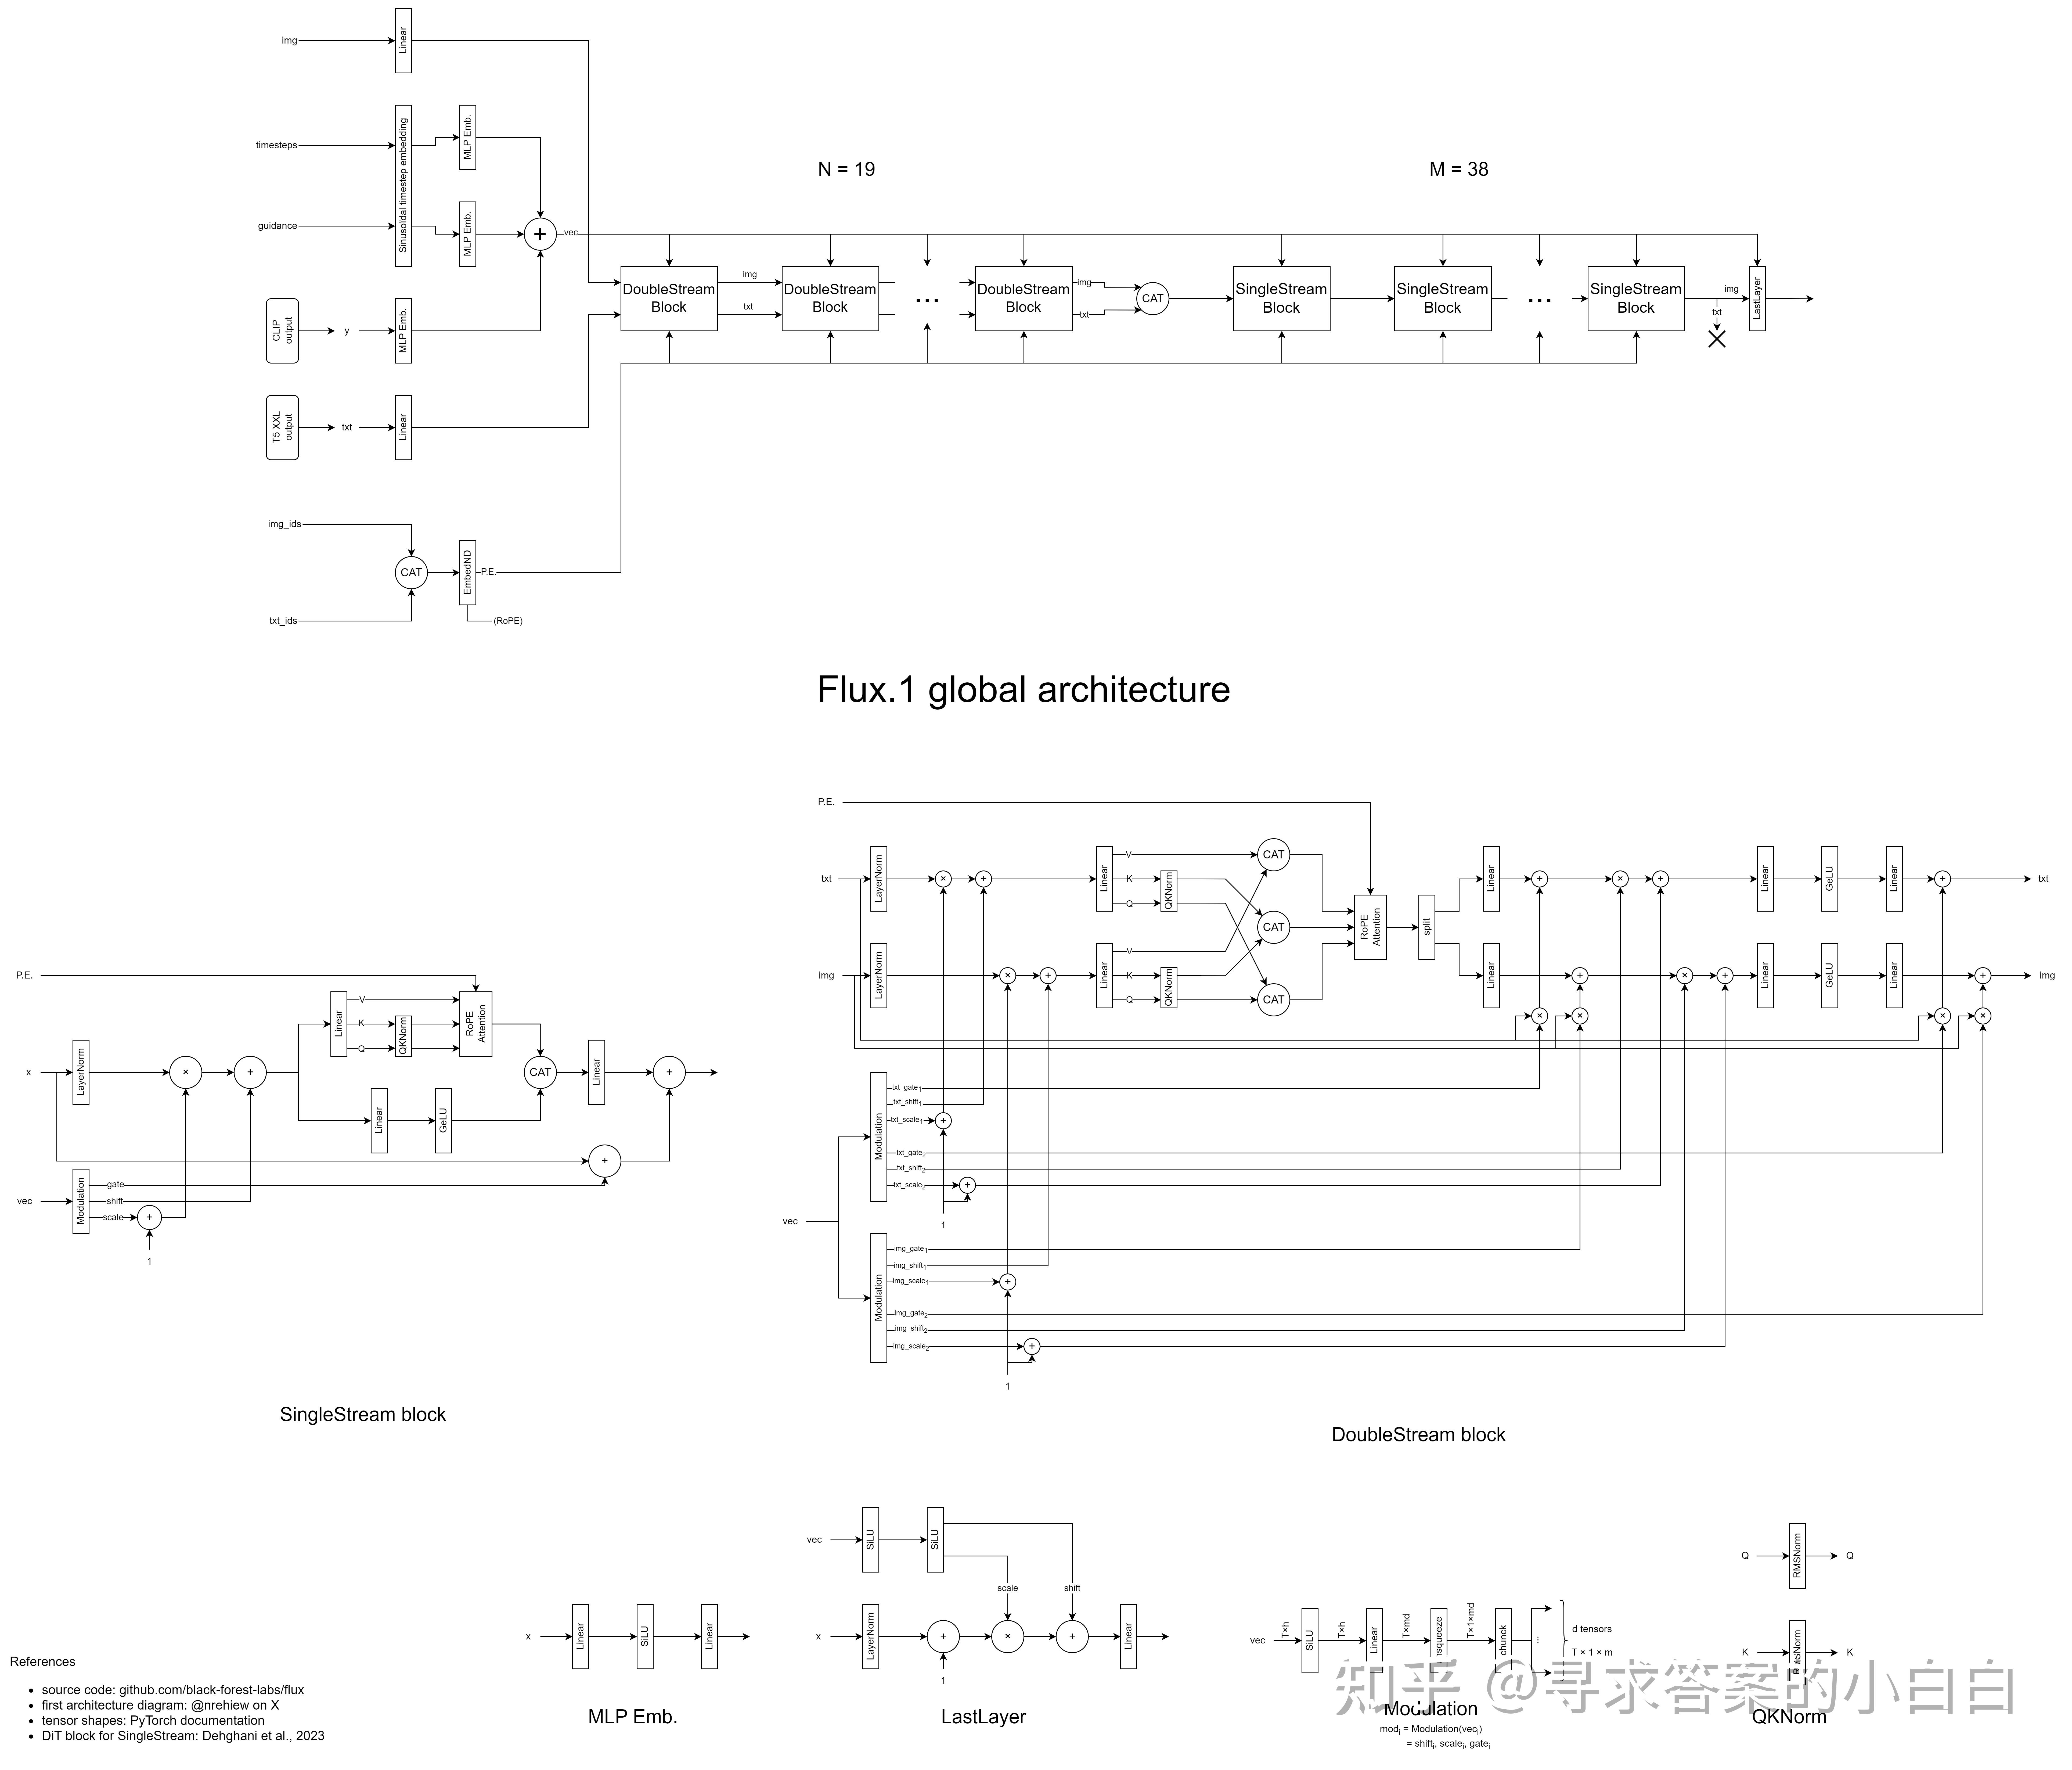
In this post, I’ll walk through how I built a tool to visualize attention maps from transformer-based diffusion models — specifically Flux, which uses the MM-DiT architecture instead of the more common U-Net-based latent diffusion structure.
The goal was to better understand how token-level cross attention evolves during generation and to give users step-by-step insight into what the model is paying attention to during each denoising iteration.
How Flux Diffusion Works
Traditional latent diffusion models (like Stable Diffusion) use a U-Net architecture to iteratively denoise a latent image representation. Each U-Net block contains attention mechanisms, but their structure is entangled with convolution layers and spatial hierarchies.
Flux is different. It uses a transformer-based architecture, inspired by MM-DiT (Masked Modeling with DiT), and replaces the U-Net entirely with a long stack of transformer blocks — more like how GPT processes text than how typical diffusion models work.

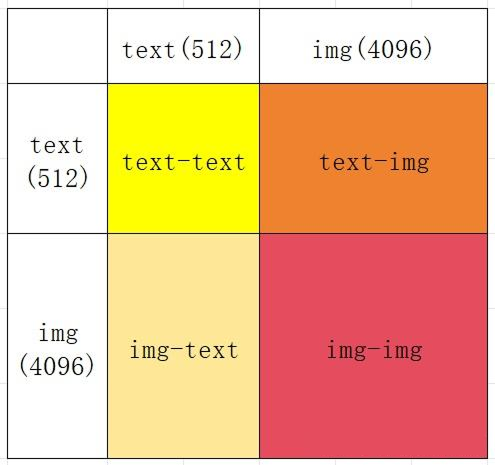
Each of the 52 transformer blocks contains what Flux refers to as Full Attention: a unified tensor that merges both self-attention (token-to-token within the image) and cross-attention (token-to-prompt).

Visualizing Attention
To understand what the model is paying attention to at each step, I extracted and averaged the cross-attention maps from each of the 52 blocks. This gives a token-level heatmap that shows how strongly each region of the image attends to each word in the prompt.
Instead of just showing a static heatmap, I wanted the tool to let users:
- Step through each denoising timestep
- View cross-attention for each token individually
- Watch how attention changes over time
This gives a much more fine-grained and intuitive view of how generation unfolds.
This interactive tool makes the denoising process less of a black box and more of a transparent loop you can inspect and play with.